
How to Calculate Stock Coverage for Your Products Step by Step
July 9, 2026
Stock coverage is how many selling days your current inventory covers, and you calculate it with one simple division: take the available units of a SKU and divide them by that same SKU’s average daily sales. If you have 300 units and sell 10 a day, your stock coverage is 30 days. That number tells you, without guessing, how long you have before you run out if you don’t restock. It’s the metric that turns “I think I have enough” into “I have exactly 30 days left.”
The formula is: stock coverage (days) = available units ÷ average daily sales. It sounds trivial, and it is when you sell on a single channel. The problem shows up when you’re a multichannel seller: you have units in Amazon FBA, others in your 3PL, others shipping from MercadoLibre Full, and your Shopify pulls from the same pool. Daily sales are split too. Calculating stock coverage “by hand” means opening three or four dashboards, exporting to Excel, reconciling dates, and by the time you’re done the number has already changed. That’s why half of this article is the formula, and the other half is how to stop calculating it by hand.
In the sections below you’ll see the step-by-step calculation, which time window to use for the average, how to treat inventory that’s in transit or reserved, and how the same number reads differently by channel. By the end you’ll have a repeatable way to get any SKU’s stock coverage in seconds.
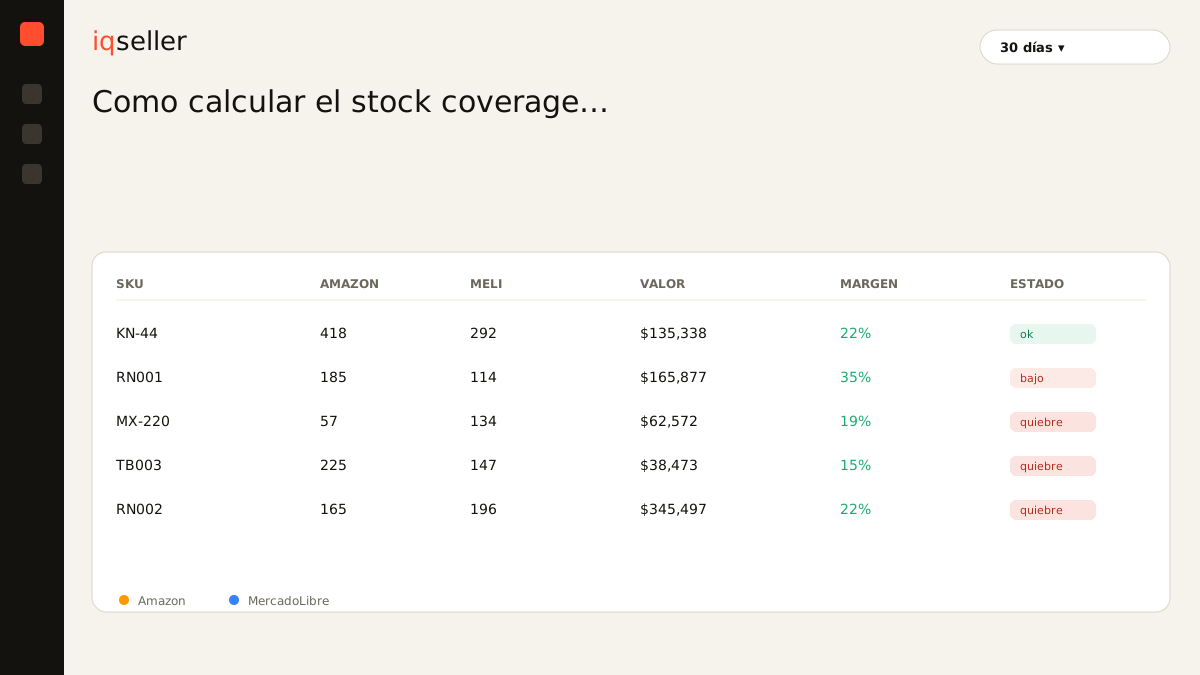
the base formula, step by step
Let’s start with the clean case: a single SKU on a single channel. The calculation has three steps.
Step 1: define your sales window. Don’t use yesterday’s sales or a single day, because a spike or a dead day distorts everything. Use an average of the last 7, 14, or 30 days depending on how stable your product is. A steady mover holds up over 30 days; a product with strong seasonality calls for 7 or 14.
Step 2: calculate average daily sales. Add the units sold in the window and divide by the number of days. If you sold 210 units in 30 days, your average is 7 units per day.
Step 3: divide available units by that average. If you have 140 units and sell 7 a day, your stock coverage is 20 days.
The detail almost everyone gets wrong here is “available.” It’s not the total inventory sitting in your warehouse: it’s the real available, meaning the units you can actually sell today, already minus what’s reserved, damaged, or in receiving quarantine. If you calculate coverage on the physical total, your number is inflated and you get comfortable right before a stockout.
which time window to use for the average
The sales window is the decision that changes your result the most, and there’s no single answer. The practical rule is: the more volatile the SKU’s demand, the shorter the window.
For stable, high-rotation products, a 30-day window gives you a smooth average that doesn’t overreact to a good weekend. For new products, products with little data, or ones that depend on promos and your price calendar, go with 7 or 14 days so the number reflects what’s happening now, not what happened a month ago.
A trick organized sellers use is to calculate two coverages in parallel: one with a 7-day window (the “fast” one) and one with 30 (the “slow” one). When the fast one drops well below the slow one, it’s a sign that demand is accelerating and your real coverage is worse than the long average suggests. That crossover is an early warning of a stockout before the “official” number turns red.
What you shouldn’t do is mix windows across SKUs without a rule. If one product uses 7 days and another uses 30, their coverages aren’t directly comparable. Set the window by product type and keep it stable so comparisons mean something.
include what’s in transit and reserved
This is where the calculation gets realistic. Your stock coverage doesn’t live off the inventory physically on the shelf today alone.
On one side you have reserved units: paid orders that haven’t shipped yet, or stock set aside for a promo. Those units can’t be sold again, so subtracting them from available is mandatory. On the other side you have units in transit: a restock you already sent to FBA or that’s coming from your supplier. Those don’t count as available today, but they do matter for deciding whether you need to order more.
The right way to handle it is to calculate two versions. The “current” coverage uses only today’s real available and tells you how long you last doing nothing. The “projected” coverage adds what’s in transit with its estimated arrival date, and tells you whether your next restock arrives in time or whether you’ll have a gap. If your current coverage is 12 days but your restock arrives in 20, you’ve got an 8-day stockout ahead of you, and the number tells you before it happens.
This is exactly the kind of accounting that becomes impossible to maintain by hand when you have dozens of SKUs spread across several channels. Each one has its available, its reserved, its transit, and its sales pace, and it all changes every hour.
stock coverage reads differently by channel
The same SKU can have healthy stock coverage on one channel and be in the red on another, even when inventory comes from the same pool. The reason is that daily sales aren’t split evenly.
Say a product sells 6 units a day on Amazon and 2 on MercadoLibre. If you have inventory dedicated per channel, coverage is calculated separately with each one’s sales. But if you share a single pool (for example, your 3PL supplies both marketplaces), the correct calculation uses combined daily sales against total available. Mixing the criteria — one channel’s available against combined sales, or the reverse — is the classic mistake that makes the number lie.
For the multichannel seller this is exactly the pain: in the Amazon dashboard you see one coverage, in the MercadoLibre one you see another, and neither considers that inventory is shared. You end up with two numbers, neither of them real. The only way to get honest stock coverage is to consolidate available and sales from all channels into a single view, and that’s where real time stops being a luxury and becomes a necessity: if you consolidate with yesterday’s data, you’ve already restocked late.
what the number is for: deciding restock
Stock coverage isn’t a report to file away, it’s a decision trigger. You use it by comparing it against your restock lead time, meaning how many days it takes from ordering to having the goods ready to sell.
The rule is direct: if your stock coverage is less than or equal to your lead time, order now. If it takes 15 days to restock and your coverage dropped to 15 days, any delay leaves you without product. Many sellers add a safety cushion and trigger the order when coverage hits lead time plus a few extra buffer days.
That “order now” threshold is what critical stock and how to set the threshold for each SKU defines in more detail: it’s not the same number for all your products. A high-rotation SKU with a long lead time needs a generous threshold; a slow product with a local supplier can live with low coverage at no risk. Coverage gives you the reading; the critical threshold gives you the line where that reading becomes action.
And watch the other extreme. Very high stock coverage — 90, 120, 180 days — isn’t good news either: it’s frozen capital, storage cost, and the risk of product that gets stuck. The number has a healthy band, neither too low nor too high, and reading that band correctly deserves its own topic.
automate the calculation instead of chasing it
You’ve seen the formula is a division. The heavy lifting isn’t the math, it’s gathering the right inputs, up to date, from all your channels, at the same time. Each SKU’s real available, its daily sales over the window you defined, what’s reserved, what’s in transit — and doing it for every product without the number being hours behind.
That’s exactly the problem that real-time, consolidated inventory solves. Instead of exporting three dashboards to Excel every morning, reconciling dates, and hoping nobody sold while you were calculating, each SKU shows its live stock coverage, with available already net of reservations and with the average sales from the right window. When a product crosses its threshold, you see it immediately, not once you’ve already run out. Measuring days of inventory stops being a manual Monday chore and becomes a number that’s always there, correct.
Well-calculated stock coverage is the difference between restocking on time and discovering the stockout when a customer already couldn’t buy from you. The formula you can do on a napkin; keeping it current for your whole catalog, across all your channels, is what actually protects you.