
What Sales Reports Amazon Seller Central Offers
August 17, 2026
Amazon Seller Central’s sales reports live in two main places: the Reports → Business Reports menu (where you see sales, units, sessions, conversion rate and Buy Box by ASIN and by day) and Reports → Payments (where you see what will actually be deposited, already net of fees). On top of that come the Fulfillment and Inventory reports if you sell via FBA, the Advertising Console for your campaigns, and the Selling Partner API or Data Kiosk downloads for anyone who wants the raw data. In short: there is no single “sales report” — there is a family of reports, each looking at a different slice of the same number.
And that is where the real pain for a seller begins. Each report uses its own definition of a “sale” — one counts orders, another counts shipped units, another counts money collected — and none of them tells you your margin. If you also sell on MercadoLibre, Shopify, or move stock through a 3PL, you end up exporting four or five spreadsheets, stitching them by hand and hoping the dates line up. That manual work, repeated every Monday, is exactly why most sellers can’t say with certainty how much they actually made last week.
This article walks through which report is for what, where each one’s trap is, and why pulling them into a single real-time view changes the way you decide on price, restock and advertising.
business reports: the heart of your sales
The most used one. Under Reports → Business Reports Amazon gives you several views: Sales and Orders by Month, Detail Page Sales and Traffic (the famous by-ASIN report) and its “by Parent Item” or “by Child Item” versions. Here you find the columns that really matter for reading performance: Ordered Product Sales, Units Ordered, Sessions, Page Views, Unit Session Percentage (your conversion rate) and Buy Box Percentage.
The trap: Business Reports counts ordered sales, not money collected or shipped. An order the customer cancels five minutes later still shows up here that day. That’s why the Business Reports number almost never matches Payments to the cent — and that’s fine, because they measure different things. For product diagnosis (what’s selling? what converts? am I losing the box?) it’s the best report. For knowing what gets deposited, it isn’t.
Glossary: what the Buy Box is and why its percentage tells you so much →payments: what actually gets deposited
Under Reports → Payments (Transaction View, All Statements, Date Range Reports) you see the real money: sale price minus referral fee, minus FBA fees, minus refunds, minus adjustments. This is the report closest to your pocket, and that’s why it’s the one you should cross against your costs.
But even Payments has a huge gap: it doesn’t know your product cost. It deducts what Amazon charges, but not what the unit cost you, the inbound freight to the warehouse, or the share of your advertising that pushed that sale. Payments gives you revenue net of fees; to reach your true profit you still have to subtract everything of yours. That last subtraction is the one nobody does in Seller Central — because Seller Central doesn’t have your costs.
Glossary: real net margin, with cost and advertising deducted →fulfillment and inventory: the FBA angle
If you sell via FBA, Reports → Fulfillment gives you sales reports from the logistics side: Amazon Fulfilled Shipments (every shipped unit, with date, city and ASIN), All Orders, and the inventory reports that tell you what’s left and what’s about to run out. Here “sale” means shipped unit — yet another definition.
These reports are gold for crossing sales against restocking: they show the real sell-through velocity per SKU, which is exactly what you need to avoid running out of stock mid-promotion. The problem, again, is that they live in their own menu, with their own date format and their own granularity, separate from Business Reports and Payments. Reconciling the three by hand is an exercise in patience.
advertising: the report that tells you what selling cost
Sales aren’t free. The Advertising Console (Campaign Manager, Bulk Reports, Search Term Report) holds the spend you have to subtract from revenue to know whether the product truly won. Here you see spend, attributed sales, ACoS and TACoS. Without this figure your sales report tells an incomplete story: it looks like you won, but half went to advertising you never saw.
The challenge is that Advertising lives in a console separate from Seller Central. It’s a fourth report, with its own session and its own date ranges. Crossing “I sold X” with “I spent Y on ads to sell it” is one of the most valuable reconciliations and one of the least done — precisely because they sit on separate screens.
the raw data: selling partner api and data kiosk
For anyone who doesn’t want to download spreadsheets by hand, Amazon offers the Selling Partner API (SP-API) and Data Kiosk, which deliver the same sales, traffic and economics data programmatically. It’s the “right” way to automate: instead of exporting Business Reports every Monday, a system pulls them on its own, every day, with no copy-paste errors.
The catch is that the SP-API isn’t for everyone — it needs credentials, development and maintenance. That’s exactly the heavy lifting a sales-intelligence tool takes off your plate: it consumes the API, pulls Business Reports, Payments, Fulfillment and Advertising, and hands you the number already reconciled. If you’re thinking about scaling your operation, it’s worth first reviewing how to switch from Individual to Professional on Amazon, because several of these reports and accesses depend on the Professional plan.
the multichannel seller problem
Here’s the knot. Everything above is Amazon only. The moment you add MercadoLibre, Shopify or a 3PL, each platform brings its own set of reports with its own definition of a sale, its own currency of fees and its own catalog. The multichannel seller ends up with six tabs open and a master spreadsheet built by hand every week — one that almost always has misaligned dates and a total that matches no deposit.
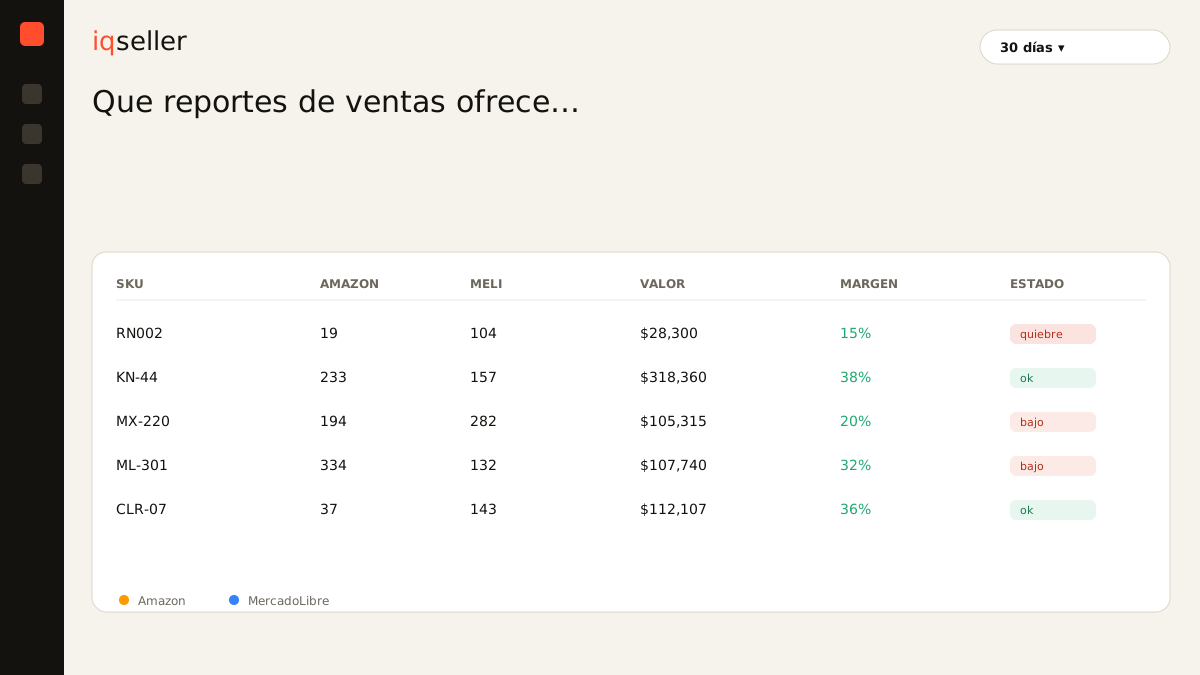
That’s exactly the work that real time eliminates. Instead of exporting and pasting, a unified panel consumes each channel’s reports, normalizes them into a single unified catalog and shows you sales, units, fees and margin together, updated on their own. You stop asking “how much did I sell?” and start asking “how much did I make, by product, by channel, today?”. That same unified view is what makes an automatic price calendar make sense: you can’t set smart per-channel prices if you can’t see each channel’s real margin in one place.
Glossary: what the unified catalog is and why it’s the foundation of everything →how to choose which report to look at
Practical rule: use Business Reports to understand what sells and what converts, Payments to see real money after fees, Fulfillment to cross sales against inventory, and Advertising to know what selling cost. None alone gives you the full picture — and that’s the point. The useful question isn’t “what sales reports does Amazon Seller Central offer?” but “how do I combine the four without losing a whole Monday building a spreadsheet?”. The answer, for a seller who also sells off Amazon, is a dashboard that reconciles them for you and lets you decide with the right number, not the one that’s easiest to export.