
ACoS definition on Amazon: where it appears and which report it comes from
July 13, 2026
The ACoS definition on Amazon is concrete: it’s the percentage of your advertising-attributed sales that you spent to pay for those same ads, and it isn’t a number you invent — Amazon Ads calculates it and publishes it inside its own reports. Formula: ACoS = ad spend ÷ sales attributed to those ads, times 100. If Amazon tells you that you spent $3,000 on clicks and those clicks generated $12,000 in attributed sales, your ACoS is 25%. That percentage comes pre-served in the console.
But the question almost no one answers well is not “what is it” but “where does it come from.” The ACoS you see appears in several places across Amazon Ads — the campaign summary, the per-SKU view, and above all the downloadable Sponsored Products report — and each view uses the same formula but with different attribution windows and levels of aggregation. That’s why the same product can show you a slightly different ACoS depending on where you look, and why your Excel almost never reconciles to the cent with the console.
This article grounds the ACoS definition on Amazon in practical terms: exactly where the number appears, which report it’s generated from, how the platform calculates it behind the curtain, and why the moment you sell on more than one marketplace that percentage stops being a single truth and becomes several you have to reconcile by hand.
the formal definition, in one line
Amazon defines ACoS (Advertising Cost of Sales) as ad spend divided by the sales that spend generated, expressed as a percentage. The key is the denominator: it isn’t your total sales, it’s attributed sales — the purchases Amazon credits to a click on your ad within its attribution window (usually seven days for Sponsored Products). An organic, branded, or repeat-purchase sale outside that window doesn’t enter the calculation.
That’s why ACoS is a metric of paid-investment efficiency, not profitability. Amazon doesn’t put your product cost into the formula, nor its category referral fee, nor the FBA fee, nor tax. The number is honest about what it measures — how much each ad dollar returned — but silent about whether you made money. Understanding where the data comes from is the first step to not treating it as something it isn’t.
Dictionary: ACoS is ad spend divided by the sales attributed to those ads; a low ACoS does not guarantee profit.where ACoS appears inside Amazon Ads
ACoS doesn’t live in a single place. In the Amazon Ads console you see it, at minimum, across three views. The first is the campaign summary: a table with each campaign and its ACoS for the selected period. The second is the ad-group and product detail, where the same percentage drops down to the ASIN or SKU level. The third — and the most important for anyone who wants to reconcile numbers — is the downloadable report, which exports the raw rows with impressions, clicks, spend, attributed sales, and the ACoS already calculated.
Every view uses the same definition, but the number may not match between them for two reasons. One is aggregation: a campaign’s ACoS is total campaign spend over its total attributed sales, not the average of its products’ ACoS values. The other is the attribution window and the cutoff date: the console usually shows “live” data that’s still settling, whereas a downloaded report freezes a snapshot. If you compare today’s dashboard against yesterday’s report, it’s normal for them to differ a little.
which report it comes from: the Sponsored Products report
When someone asks “which report does ACoS come from?”, the canonical answer is the Sponsored Products campaign report (and its equivalents for Sponsored Brands and Sponsored Display). That’s where Amazon hands you the source columns: Spend, 7 Day Total Sales (attributed sales in the 7-day window), and ACoS itself as a derived column. If you take the spend column and divide it by the attributed-sales column, you reproduce exactly the percentage Amazon placed beside it. That’s the report the number “comes from.”
There’s a nuance that trips up many sellers: Amazon offers the report with different attribution windows (for example, 7 days and 14 days) and different levels (campaign, ad group, search term, advertised product). ACoS changes depending on which you pick, because the attributed-sales denominator changes. A 14-day report almost always shows a lower ACoS than the 7-day one, simply because it captures more sales inside the window. It’s not that one is “wrong”: they’re two valid definitions of the same metric, and you have to know which one you’re reading before drawing conclusions.
Dictionary: real available stock is sellable inventory net of reservations and in-transit units; if it drops, your conversion falls and your ACoS rises without the campaign having changed.how Amazon calculates it behind the scenes
Behind the percentage there’s an attribution process worth understanding, because it explains many discrepancies. When someone clicks your ad and then buys — the same product or another from your catalog — within the attribution window, Amazon adds that sale to the denominator. Spend, by contrast, is recorded at the moment of the click. This creates a timing gap: today’s spend can pair with sales that close tomorrow or the day after, which is why the ACoS of the last few days is always “green,” incomplete, until the window finishes closing.
Amazon also attributes sales of products other than the one advertised (brand halo or catalog sales), which inflates the denominator and legitimately lowers ACoS but is hard to trace to a single SKU. And attributed sales are reported in the marketplace’s currency and time zone, with its own criterion for what counts as a sale (order created, not necessarily delivered or paid). None of these rules is a secret, but together they explain why your manual calculation — done with your own definition of “sale” and your own time zone — rarely lands exactly on the console’s number.
why your Excel almost never matches the console
This is where the seller loses whole afternoons. You download the report, paste it into a sheet, cross the spend against your order-system sales, and it doesn’t reconcile. The reasons are almost always the same: you’re mixing attributed sales (from Amazon Ads) with total sales (from your business report); you’re using a different attribution window than the one the report carries; your time zone cuts the day at a different point; or you simply downloaded the snapshot before the window finished settling and there are sales not yet attributed.
None of those mismatches means Amazon is wrong or that you are. It means several valid definitions are coexisting and that pairing them by hand is fragile. If your goal is to read ACoS to decide bids, the trap is treating your Excel as the truth and the dashboard as the error, or the reverse. The way out isn’t to argue which one wins, but to have a single layer that takes Amazon’s report exactly as Amazon defines it and places it next to your real margin, without you prorating anything at midnight. And here it helps to tell ACoS apart from TACoS, because they measure different pictures: we break it down in TACoS vs ACoS.
the same number, multiplied by each channel
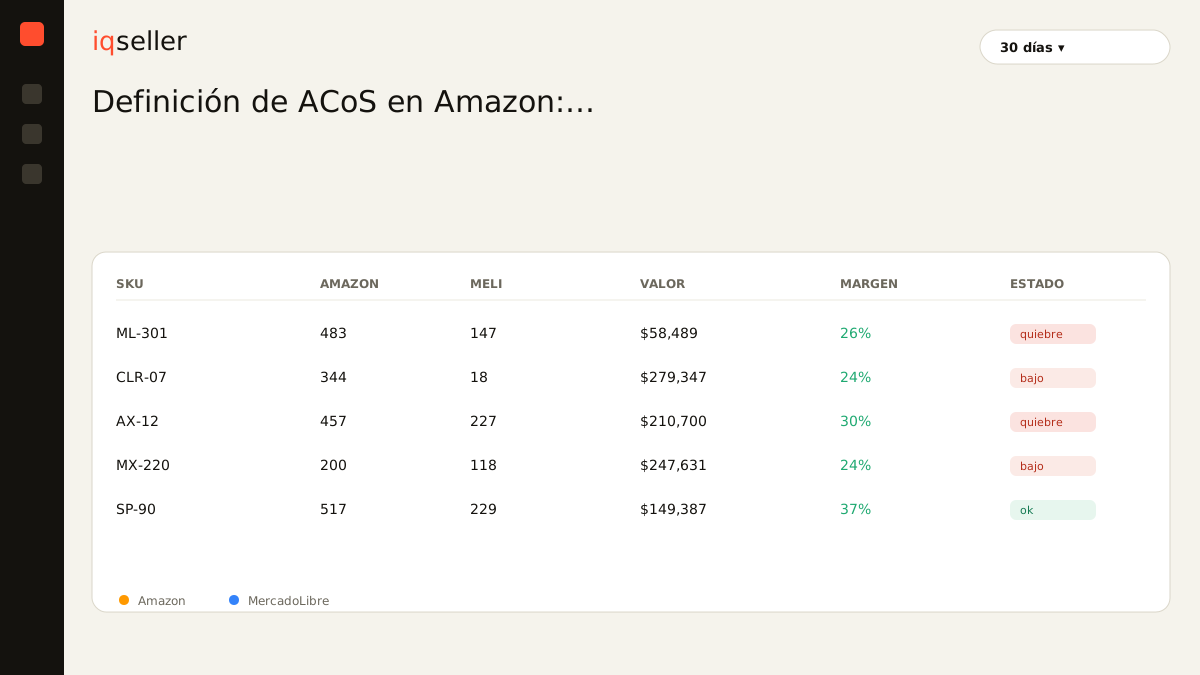
For a single marketplace, the ACoS definition already demands care. The moment you sell on Amazon Mexico, MercadoLibre, and maybe Shopify with a 3PL, the problem multiplies. Amazon gives you its ACoS from its Sponsored Products report with its attribution window. MercadoLibre reports Product Ads spend with a different logic, a different window, and a different column name. Each platform “defines” ACoS its own way, so the ACoS from one panel isn’t directly comparable with another’s without normalizing them first.
And break-even — the maximum ACoS you can bear before losing money — changes by channel, because referral fees and fulfillment differ. An ACoS of 25% can leave you profit on MELI and make you lose on Amazon for the same product. If you look at one dashboard at a time, you never see that asymmetry; you end up exporting each channel’s report, pairing SKUs that are named differently, and building a table that’s already stale by the time you finish it. A panel that joins each channel’s report in real time, with ACoS already normalized and placed next to your price calendar and your real margin, turns those three tabs into a single reading.
Dictionary: real net margin is what’s left after ALL costs — product, fees, shipping, tax, and advertising — not just price minus cost.what to remember
The ACoS definition on Amazon is simple — ad spend over attributed sales, as a percentage — but its origin isn’t quite as simple. The number comes from the Sponsored Products report, appears across several console views with different aggregations, and changes depending on the attribution window you pick. Amazon calculates it with its own attribution logic, currency, and time zone, which is why your manual Excel rarely reconciles to the cent.
Once you know where the data comes from, you stop fighting the discrepancies and start reading it well: as an honest lens on your paid spend in one channel, one that only makes sense placed next to your real margin and reconciled against the same data in your other marketplaces. That’s the difference between copying a percentage from a report and understanding what it’s telling you.