
What Are Days of Inventory and How to Use Them to Plan Purchases
July 24, 2026
Days of inventory is a metric that tells you how many days your current stock will last if you keep selling at the pace of the last few days. It’s a simple division: take the available units of a product and divide them by your average daily sales. If you have 300 pieces of a SKU and you sell 20 a day, your days of inventory is 15. In fifteen days, if you buy nothing, you hit zero.
That’s the whole idea, and that’s exactly why it’s so useful for planning purchases: it turns a number that says little on its own (how many units you have) into a number that actually makes decisions (how much time you have left). A seller who sees “300 units” doesn’t know whether that’s a lot or a little. A seller who sees “15 days of inventory” knows right away whether they should already be cutting a purchase order or whether they can calmly wait another couple of weeks.
The trouble starts when you sell across several channels. Your stock is spread across Amazon FBA, your warehouse for MercadoLibre, maybe a 3PL, and some inventory of your own for Shopify. Each dashboard shows its units separately, and each one calculates “its” daily sales its own way. Piecing all of that together by hand in a spreadsheet to get the real days of inventory for every product is exactly the kind of task that gets done badly, late, and with yesterday’s data. This is where having your information consolidated and in real time completely changes the quality of your purchasing decisions.
how days of inventory is calculated
The base formula is direct: days of inventory = available units ÷ average daily sales. What matters isn’t the division, but which numbers you feed into it, because that’s where most calculations go wrong.
For the units, you need the real available stock, not the availability a single channel shows. Real available is what you can actually sell: it subtracts units reserved by in-process orders, units in transit to a fulfillment center, and anything blocked for some reason. If you use the “pretty” number from a dashboard, your days of inventory will tell you that you have more cushion than you really do.
For average daily sales, the detail is in the time window. A 7-day average reacts fast but gets contaminated by any spike; a 30-day one is steadier but slow to reflect a shift in demand. For products with even sales, 14 to 30 days works well. For seasonal products or ones you just pushed into a campaign, it’s better to look at short windows and adjust by hand. Adding up units from every channel but dividing by the sales of just one is a classic mistake: if you sell on Amazon and Meli, daily sales should be the sum of both channels, not just your main marketplace.
why this metric matters for a multichannel seller
When you run a single channel, “how many units do I have” is almost enough. In multichannel, it isn’t. The same SKU can have 40 days of inventory on Amazon and 4 in your Meli warehouse at the same time, because sales velocity and stock levels differ on each side. A global average hides that imbalance: on paper you’re healthy, but one of your channels is about to run dry while the other is sitting on plenty.
That’s why days of inventory reads better per channel and also consolidated. The per-channel number tells you where you’ll hit a stockout first and where you might need to move product from one side to the other. The consolidated number tells you whether, overall, it’s time to order more from your supplier. The two readings together are what plan a purchase well.
And all of this lives or dies by data freshness. Days of inventory calculated with last night’s stock and last week’s sales gives you an old snapshot. If a run of orders came in this morning, your real number has already changed and you don’t know it. Real time isn’t a cosmetic luxury here: it’s what keeps the metric true at the moment you use it to decide.
from days of inventory to a purchasing decision
Days of inventory doesn’t say “buy” on its own. It tells you how much time you have. The purchasing decision comes from comparing that time against your lead time: how long your supplier takes to restock and get the product available to sell.
The mental rule is simple. If your days of inventory is less than or equal to your lead time, you’re already late: by the time your order arrives, you’ll have run out. If it’s a little more than the lead time, you’re right at the reorder point and should cut the order today. If it’s much more, you can wait. An example: if you have 15 days of inventory and your supplier takes 12 days to restock, you have barely 3 days of margin. That’s an urgent order, not something to leave for next week.
This is where days of inventory connects directly to the reorder point: the reorder point is, at its core, the stock level at which your days of inventory drops to match your lead time plus a safety cushion. Seeing the metric in days, rather than in loose units, is what makes that calculation intuitive instead of a formula you copy and paste without understanding.
how much to order, not just when
Knowing when to order is half of it. The other half is how much. Days of inventory helps here too, because it lets you reason in time instead of in loose units.
First decide what coverage you want to have after receiving the purchase. Say you want to cover 45 days of sales. Multiply your average daily sales by 45 and that’s your target inventory. Subtract what you’ll have available the day the goods arrive (your real available today minus what you’ll sell during the lead time) and the difference is how much to order. Thinking about it this way avoids the two expensive mistakes: ordering too much and tying up capital in product that turns slowly, or ordering too little and being back in emergency mode in two weeks.
This calculation shifts with the season. If a big date is coming, your projected daily sales rise, and your current days of inventory, measured with normal sales, is lying to you optimistically. There it helps to lean on a price and demand calendar to anticipate the spike and adjust how much you buy before the window closes.
common mistakes when reading the metric
The first one we already mentioned: using channel availability instead of real available. It inflates your days of inventory and makes you buy late.
The second is picking the wrong sales-average window. If a product had a three-day spike from a promo and you calculate over those days, your daily sales get inflated and your days of inventory comes out artificially low: you’ll over-order. The reverse, if you measure over a valley, comes out high and lulls you into complacency.
The third is ignoring the per-channel breakdown and keeping only the global number, which, as we saw, hides imbalances. The fourth is not updating: a calculation done once a month stops reflecting reality almost immediately in a business with daily sales. And the fifth is treating every SKU the same. Your high-turnover products need you to watch their days of inventory almost daily; long-tail ones tolerate more spaced-out reviews.
how real time solves it
The heavy lifting in days of inventory isn’t the formula, it’s gathering clean, fresh data from several places. That’s where a consolidated panel connecting your channels takes away the tedious part.
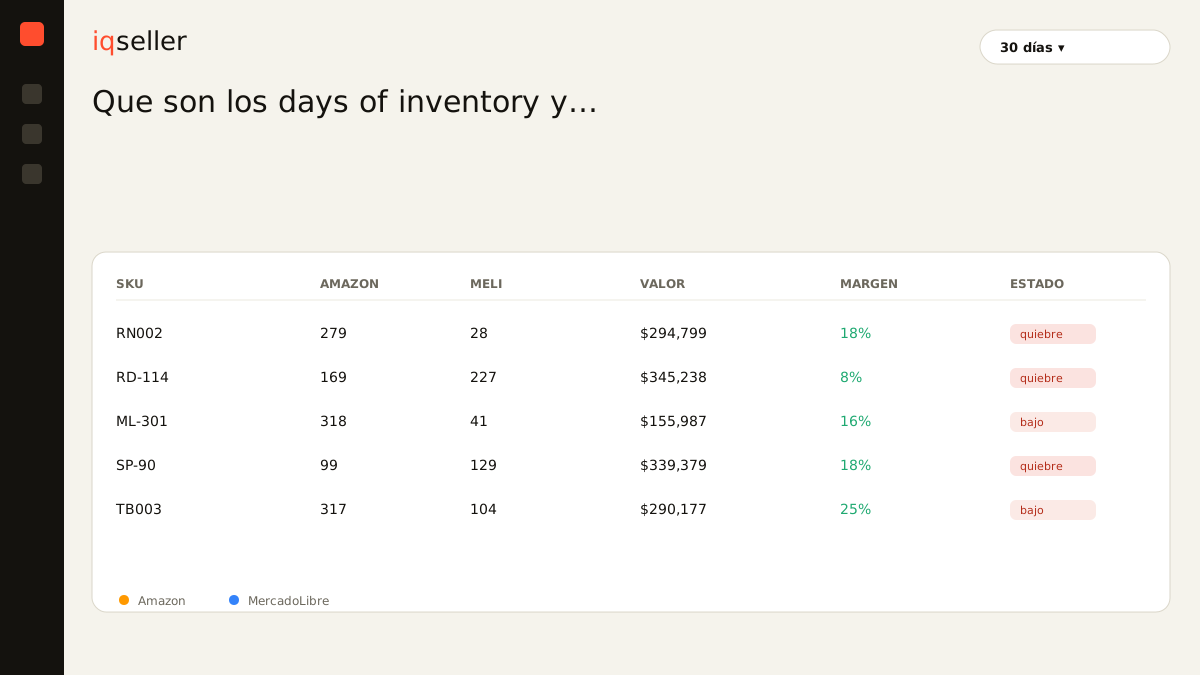
Instead of downloading reports from each dashboard, pasting them into a spreadsheet, and hoping the columns line up, you see for each SKU its real available per channel, its average sales over the window you choose, and its days of inventory already calculated, updating as orders come in. You can sort by the products with the fewest days to tackle the urgent ones first, cross-check against your lead time, and build the purchase order on today’s data, not last week’s. The “will I have enough?” uncertainty becomes a number you can see and trust.
Days of inventory is, in the end, a way to translate your inventory into the one language that matters for buying well: time. How many days you have left, per channel and in total, measured with real and fresh data. With that, planning a purchase stops being a hunch and becomes a decision.